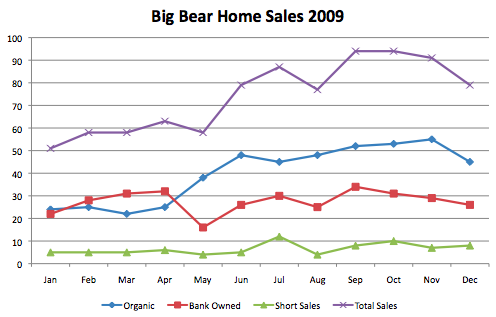
The real estate market in Big Bear for 2009 can be summed up in 9 words – Sales up, Prices down but stabilizing, & Inventory shrinking. Did you count? :).
Big Bear home sales rose 33% in 2009 while the median and average sales prices dropped 17% from the 2008 numbers.
Year to Year Comparison
| Year | # of Homes Sold | Median Sales Price | Average Sales Price | Days on Market | List Price to Sales Price |
|---|---|---|---|---|---|
| 2009 | 892 | $211,000 | $276,676 | 133 | 95% |
| 2008 | 669 | $253,000 | $331,431 | 135 | 94% |
| 2007 | 786 | $310,000 | $403,812 | 124 | 95% |
| 2006 | 1155 | $319,500 | $400,232 | 83 | 97% |
| 2005 | 1802 | $290,000 | $355,918 | 68 | 98% |
| 2004 | 1905 | $235,000 | $276,716 | 76 | 98% |
| 2003 | 1646 | $188,000 | $228,284 | 61 | 98% |
Homes sales picked up as expected during the busy summer and fall months while tailing off towards the end of the year. The 4th quarter of 2009 was the best we’ve seen for home sales since the 4th quarter of 2006 – a nice way to head into 2010.
Fourth Quarter Comparison (10/1 – 12/31)
| Year | # of Homes Sold | Median Sales Price | Average Sales Price | Days on Market | List Price to Sales Price |
|---|---|---|---|---|---|
| 2009 | 264 | $215,000 | $286,771 | 144 | 95% |
| 2008 | 171 | $252,000 | $340,810 | 145 | 93% |
| 2007 | 171 | $292,500 | $362,990 | 129 | 94% |
| 2006 | 278 | $320,000 | $420,408 | 101 | 96% |
| 2005 | 465 | $314,900 | $370,722 | 68 | 98% |
| 2004 | 512 | $252,750 | $295,462 | 74 | 97% |
| 2003 | 474 | $200,000 | $240,941 | 76 | 97% |
2009 Big Bear Real Estate Breakdown
By Price Range –
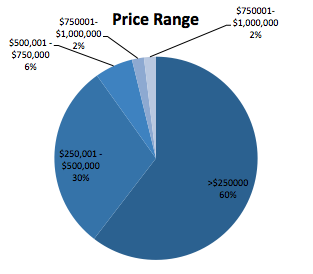
90% of the home sales in Big Bear were under the $500,000 price point. I expect that to continue in 2010. This goes to show the lower end will see less depreciation on values as that is were the demand is. The upper end of the market however, will continue to see values decrease in 2010. It is important to note that when looking at what is currently for sale, 23% of what is listed in over the $500,000 mark, which is over 2x the demand.
By Location –
Sales were pretty evenly split between the East end of the Valley and the West side. Big Bear City topped the sales with 200 homes sold in 2009. Moonridge and Sugarloff round out the top three areas.
By Category –
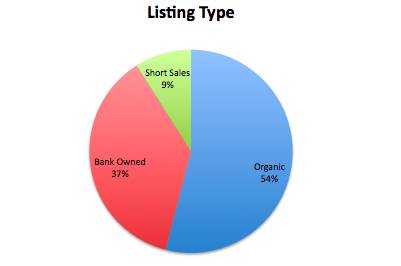
482 (54%) organic or traditional sales, 330 (37%) bank owned or REO sales, and 80 (9%) short sales. Bank owned sales continue to be the hot ticket – making up 37% or the sale yet only 9% of what is currently for sale.
Big Bear Foreclosure Update
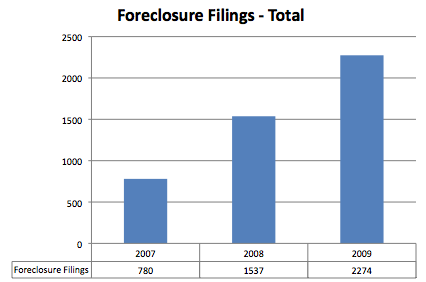
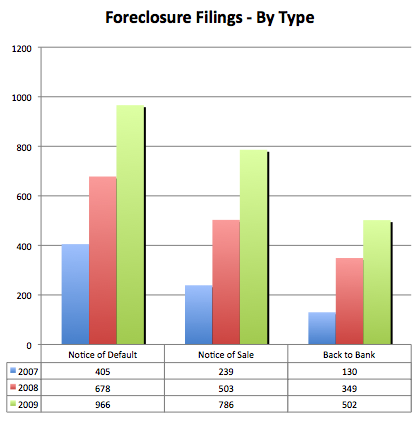
Foreclosure filings were at all time highs in 2009. Expect to see similar numbers in 2010 as well.
Overall, foreclosure filings were up 50% in 2009 as compared to 2008, and nearly 300% from the 2007 numbers.
Broken down by the type of filing, here are the numbers – Notices of Default, which starts the foreclosure process, were up 47% in 2009. Notices of Sale, which sets the sale date for the property, were up 59% in 2009. And properties taken back by the bank at the sales in 2009 were up 44%.
That about does it on my side for the year end stats. If there is anything in particular you want to know that I did not cover, feel free to leave a comment and I will see what I can do.
* Note: The charts above represent single family homes in the Big Bear area, including Big Bear Lake, Big Bear City, Moonridge, Fox Farm, Sugarloaf, Erwin Lake, & Fawnskin. Data courtesy of the Big Bear MLS. These numbers do not include raw land or condos nor does it include homes in the Big Bear MLS that are located out of the Big Bear area, or homes not listed in the Big Bear MLS.





Speak Your Mind