Big Bear Home Sales

Big Bear home sales remained strong in November as the real estate market appears to be hitting its stride.
Home sales in November were down 6% when compared to the October sales (88 v. 94), but were up a whopping 76% when compared to the same month last year (88 v. 50).
Historically, these numbers are on the low end. But, comparing them to the number of monthly sales over the past couple years, they are stronger and a welcome sign.
27, or 31%, of the 88 home sales in Big Bear were bank owned, about 3% less than last month. That percentage has been slowly going down over the past 6 months. Earlier in the year, bank owned sales made up closer to 40-50% of the total sales. 7 of the sales, or 8%, were short sales, which is also 3% less than last month.
That means 54, or 61%, of the sales in November 2009 were “organic”, or traditional sellers – an increase of about 6% from last month.
Bank owned properties currently only make up 7% of what is for sale in Big Bear, yet they continue to make up between 30% to 40% of what is selling every month.

Big Bear Home Prices
The median sales price in November 2009 was on the rise for a third straight month. It rose 7% from the October number ($222,450 vs. $206,500), though it is down 7% from the November 2008 median ($222,450 vs. $240,287).
It appears as though the pricing bottom may have been hit but it’s too early to tell IMO.
There remains nearly $75,000 difference in the median sales price of $222,450 and the median asking price of $299,900.

Homes Currently on the Market
The number of homes for sale in Big Bear dropped 7% from October. Year over year, it is down 31%. There are less homes for sale in Big Bear now than in any time in the past 3-4 years. If you are a buyer, prices may be low, but options are becoming more limited. With limited options means more competition from other buyers, especially with the good properties. Expect multiple offers and lots of interest on anything considered desirable.
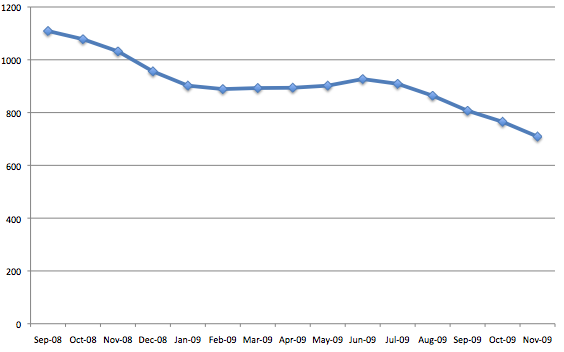
Big Bear Home Sales – Thru November 2009
| Month and Year | # Homes For Sale | Median Asking Price | # Homes Sold | Median Sales Price |
|---|---|---|---|---|
| Nov 2009 | 709 | $299,900 | 88 | $222,450 |
| Oct 2009 | 765 | $299,900 | 94 | $206,500 |
| Sept 2009 | 807 | $310,000 | 94 | $190,358 |
| Aug 2009 | 864 | $313,000 | 75 | $170,400 |
| July 2009 | 909 | $309,000 | 87 | $225,000 |
| June 2009 | 927 | $310,000 | 78 | $265,000 |
| May 2009 | 902 | $316,000 | 56 | $235,000 |
| April 2009 | 894 | $300,000 | 61 | $205,000 |
| Mar 2009 | 893 | $299,950 | 54 | $179,500 |
| Feb 2009 | 889 | $309,000 | 57 | $217,000 |
| Jan 2009 | 902 | $319,000 | 47 | $220,000 |
| Dec 2008 | 956 | $320,905 | 41 | $262,000 |
| Nov 2008 | 1032 | $325,000 | 50 | $240,287 |
| Oct 2008 | 1078 | $329,000 | 73 | $255,000 |
| Sept 2008 | 1109 | $328,500 | 82 | $224,500 |
| Aug 2008 | 60 | $282,500 | ||
| July 2008 | 62 | $205,000 | ||
| June 2008 | 62 | $247,500 | ||
| May 2008 | 67 | $290,000 | ||
| April 2008 | 50 | $299,500 | ||
| Mar 2008 | 1082 | $339,950 | 49 | $288,000 |
| Feb 2008 | 1049 | $345,000 | 34 | $249,950 |
| Jan 2008 | 1094 | $339,900 | 30 | $283,250 |
| Dec 2007 | 55 | $273,750 | ||
| Nov 2007 | 66 | $282,500 |
Year to date, sales are up 29% from 2008, but the median and average prices are each down 17%. What also important to note below is that sales in Big Bear peaked in 2004, yet prices remained high until 2007. Conversely, even if sales start to pick up now, it will most likely take a few years to see any significant price appreciation. I am thinking 3-5 years.
Year To Date Comparison (1/1- 11/30)
| Year | # of Homes Sold | Median Sales Price | Average Sales Price | Days on Market | List Price to Sales Price |
|---|---|---|---|---|---|
| 2009 | 808 | $210,000 | $273,817 | 131 | 95% |
| 2008 | 625 | $253,000 | $330,201 | 136 | 94% |
| 2007 | 734 | $314,500 | $407,424 | 123 | 95% |
| 2006 | 1061 | $319,300 | $397,086 | 81 | 97% |
| 2005 | 1647 | $289,900 | $356,108 | 68 | 98% |
| 2004 | 1738 | $230,000 | $274,615 | 75 | 98% |
| 2003 | 1481 | $185,500 | $226,535 | 58 | 98% |
Want more? Be sure to sign up for my email newsletter or RSS feed.
* Note: The charts above are updated on a monthly basis. They represent single family home sales in the Big Bear area, including Big Bear Lake, Big Bear City, Moonridge, Fox Farm, Sugarloaf, Erwin Lake, & Fawnskin. Data courtesy of the Big Bear MLS. These numbers do not include raw land or condos nor does it include homes in the Big Bear MLS that are located out of the Big Bear area or home sales not listed in the Big Bear MLS.
Related Articles
Big Bear Home Sales – October 2009




Speak Your Mind