 Home sales in Big Bear dropped 6% in October 2010. The median sales price dropped considerably, down 12%, while average sales price dropped 16% in October.
Big Bear Home Sales
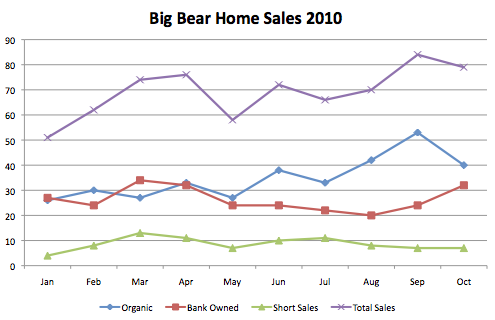
Home sales in October (79) were down when compared to the September sales (84). Year over year, sales were down 17% from October 2009 (94).
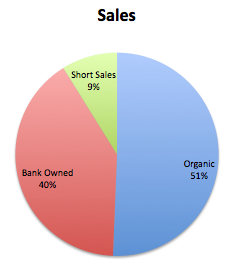
32, or 40%, of the 79 sales were bank owned, up 11% from last month and more in line with what we’ve been used to seeing.
7 of the sales, or 9%, were short sales, which is 1% more than last month.
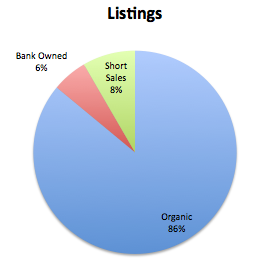
October was another strong month for organic sellers though their percentage did drop. 40, or 51%, of the Big Bear home sales in October were organic, or traditional sellers – a decrease of 11% from last month. Organic sellers continue to make up over 86% of the available inventory for sale, a pretty large chuck. Compared to the amount that are selling every month, which is close to 50%, there is still an oversupply. Buyers are more attracted to the bank owned and short sale properties as they believe that is where the deals can be found, and most of the time they are right.
If you are a traditional seller, you have got to keep this in mind. A lot of times your competition is not the neighbor down the street, but rather the buyer’s mindset.
Big Bear Home Prices
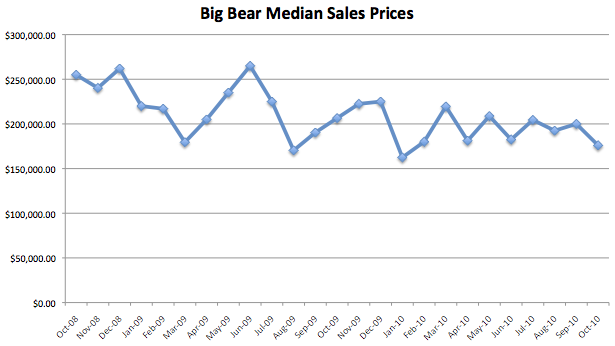
The median sales price was down from $200,000 in September to $176,000 in October, a 12% decrease. This number continues to bounce around between $160,000 and $220,000. Year over year, the median sales price was down 15% from the October 2009 median. Still a lot of volatility out there in the market when it comes to prices – all over the board with no set pattern. You have a few lakefronts or higher end sales here and there, and with the limited amount of sales out there, the prices can swayed quite a bit.
The average sales price for homes sold in October was $240,034, down 16% from the September number of $286,757. This may be attributed to less higher end sales that in the several months prior. Year over year, the average sales price was down 19% from the October 2009 average price of $294,916.
Homes Currently on the Market
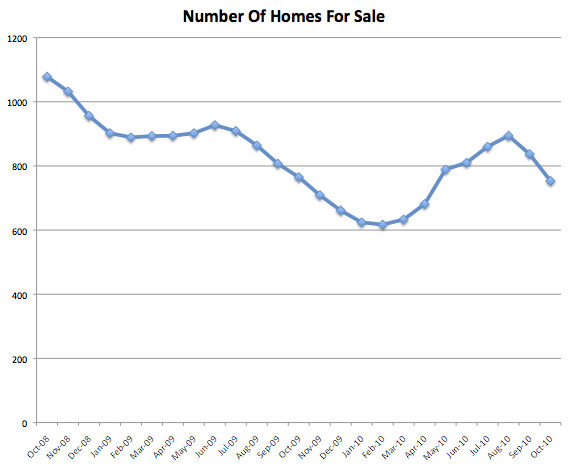
Inventory has started to drop again.
Month over month, we saw a 10% decrease (756 vs. 837) in the amount of available homes for sale in Big Bear. Inventory is down 16% from the peak we saw in August. Expect to continue to see this number dwindle as we head into the winter holidays and the 4 slowest months of the year, January thru April. While people fall in love with Big Bear because of the snow, they don’t necessarily buy homes when it is on the ground 🙂
Last year at this time, there were 765 homes on the market in Big Bear.
Here’s the breakdown of the current listing inventory – Organic, bank owned, and short sales
Big Bear Home Sales – Thru Oct 2010
| Month and Year | # Homes For Sale | Median Asking Price | # Homes Sold | Median Sales Price | Average Sales Price |
|---|---|---|---|---|---|
| Oct 2010 | 756 | $262,450 | 79 | $176,000 | $240,034 |
| Sept 2010 | 837 | $268,000 | 84 | $200,000 | $286,757 |
| Aug 2010 | 894 | $275,000 | 70 | $197,500 | $279,216 |
| July 2010 | 860 | $299,000 | 66 | $204,450 | $259,940 |
| June 2010 | 810 | $295,000 | 72 | $182,500 | $249,756 |
| May 2010 | 789 | $299,000 | 58 | $208,750 | $255,294 |
| April 2010 | 681 | $289,900 | 76 | $181,250 | $229,149 |
| Mar 2010 | 633 | $279,900 | 74 | $219,500 | $256,236 |
| Feb 2010 | 617 | $285,000 | 62 | $180,000 | $254,124 |
| Jan 2010 | 624 | $298,750 | 57 | $162,500 | $216,260 |
| Dec 2009 | 661 | $289,900 | 80 | $227,500 | $312,925 |
| Nov 2009 | 709 | $299,900 | 91 | $219,900 | $257,895 |
| Oct 2009 | 765 | $299,900 | 94 | $206,500 | $294,916 |
| Sept 2009 | 807 | $310,000 | 95 | $184,900 | $239,625 |
| Aug 2009 | 864 | $313,000 | 79 | $178,000 | $250,120 |
| July 2009 | 909 | $309,000 | 87 | $225,000 | $280,787 |
| June 2009 | 927 | $310,000 | 79 | $252,000 | $293,661 |
| May 2009 | 902 | $316,000 | 58 | $226,000 | $309,806 |
| April 2009 | 894 | $300,000 | 63 | $205,000 | $243,669 |
| Mar 2009 | 893 | $299,950 | 58 | $177,000 | $287,996 |
| Feb 2009 | 889 | $309,000 | 58 | $215,500 | $293,295 |
| Jan 2009 | 902 | $319,000 | 51 | $220,000 | $272,571 |
| Dec 2008 | 956 | $320,905 | 44 | $242,250 | $348,906 |
| Nov 2008 | 1032 | $325,000 | 50 | $240,287 | $329,953 |
| Oct 2008 | 1078 | $329,000 | 77 | $255,000 | $343,234 |
Year to Date Comparison (1/1 – 10/31)
| Year | # of Homes Sold | Median Sales Price | Average Sales Price | Days on Market | List Price to Sales Price |
|---|---|---|---|---|---|
| 2010 | 698 | $193,500 | $253,582 | 118 | 95% |
| 2009 | 722 | $207,250 | $275,359 | 130 | 95% |
| 2008 | 575 | $255,000 | $330,222 | 134 | 94% |
| 2007 | 668 | $315,000 | $412,510 | 123 | 95% |
| 2006 | 972 | $313,950 | $389,247 | 79 | 97% |
| 2005 | 1510 | $289,000 | $356,259 | 69 | 98% |
| 2004 | 1572 | $229,000 | $272,915 | 75 | 98% |
| 2003 | 1329 | $185,000 | $225,023 | 57 | 98% |
Year-to-Date comparisons – Sales are starting to lag behind the 2009 numbers, down by 3%. Compared to 2008 however, sales are still up 21%. The median and average prices are down 7% & 8% respectively from 2009, while compared to 2008 – down 24% and 23% respectively. Today’s prices are still in the 03/04 range.
So, sales have slowed down a bit overall this year and prices are still low. And don’t expect big changes on that any time soon. Most experts are thinking we are going to be in a down market for several years to come.
Til next month,
Want more? Be sure to sign up for our email newsletter or RSS feed.
* Note: The charts above are updated on a monthly basis. They represent single family home sales in the Big Bear area, including Big Bear Lake, Big Bear City, Moonridge, Fox Farm, Sugarloaf, Erwin Lake, & Fawnskin. Data courtesy of the Big Bear MLS. These numbers do not include raw land or condos nor does it include homes in the Big Bear MLS that are located out of the Big Bear area or home sales not listed in the Big Bear MLS.
Related Articles
Big Bear Home Sales – September 2010 & Third Quarter 2010
Big Bear Home Sales – August 2010




Speak Your Mind