 It’s been quite a while since I posted some stats on the Big Bear real estate market. To say things have been busy the last 8 months since my previous real estate market update would be an understatement. Things are busy in Big Bear, just not overly productive :-). “I am working twice as hard to make half as much,” I like to say. But, I’m not complaining.
That said, I had a buyer come in the office yesterday asking where to find my updated monthly sales stats for Big Bear. He was generally upset that I have not been posting them as he found them useful.
So, here goes –
Big Bear Home Sales – Year to Date (1/1/2011 thru 5/31/2011)
Home sales year to date are down 7% from 2010 – 304 total sold in 2011 vs. 326 total sold in 2010.
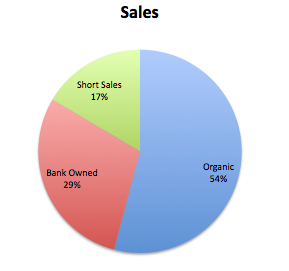
89, or 29%, of the 304 sales were bank owned, REO, or foreclosure. While this number in still elevated, it has been trending downward the past 12 months.
50 of the sales, or 17%, were short sales. This number has been trending upward slightly.
165, or 54%, of the sales so far this year have been the traditional or organic seller.
When compared to the May 2010 home sales of 58, sales in May 2011 for Big Bear homes (54) were down 8%.
One important stat to keep an eye on – 37% of the sales so far in 2011 have been cash buyers! Buyers are out there, and they are very savvy. You won’t see many cash buyers overpaying in this market, that’s for sure.
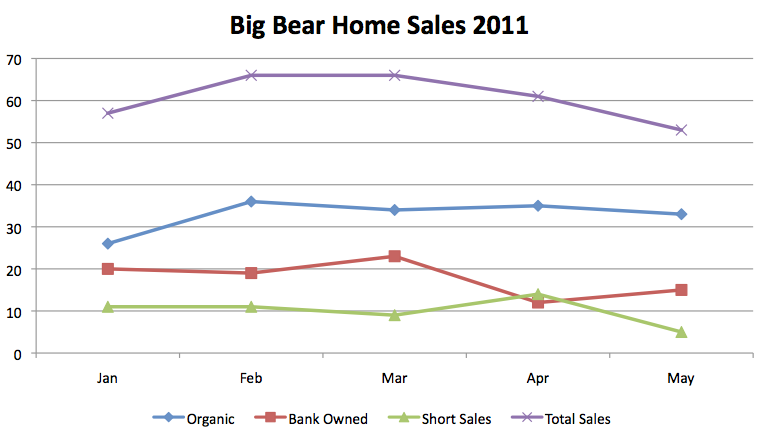
Below is the breakdown for Big Bear home sales by month and type (short sales, bank owned, or traditional/organic) of sale. So far, sales peaked in February and March at a total of 66 each month. Short sales and foreclosures flip flopped in April but every other month remained relatively status quo – about 55% organic, 30% REO, and 15% short sale.
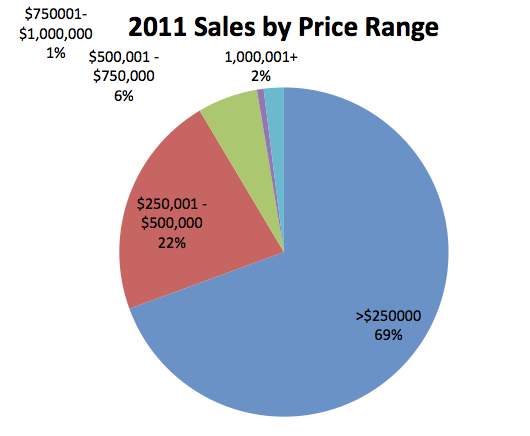
69% of the sales activity so far has been under the $300,000 price, and 91% has been under $500,000. If you are trying to sell a home in Big Bear over $500,000, this is critical information – there are not a lot of buyers out there looking in your range.
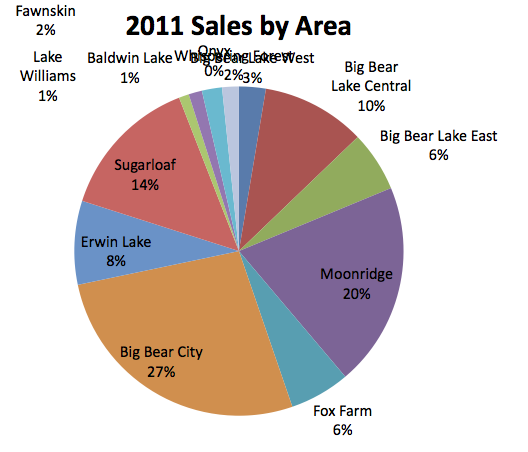
Not surprising based on the data from the price range sales, most of the sales in Big Bear are happening on the East end of town in Big Bear City, Sugarloaf, and Erwin Lake – a total of 49%. These areas are made up of lower priced properties than their competition in Big Bear Lake, so buyers are looking more there.
Moonridge and Big Bear Lake Central were the two high activity areas for Big Bear Lake, 92315.
Big Bear Home Prices
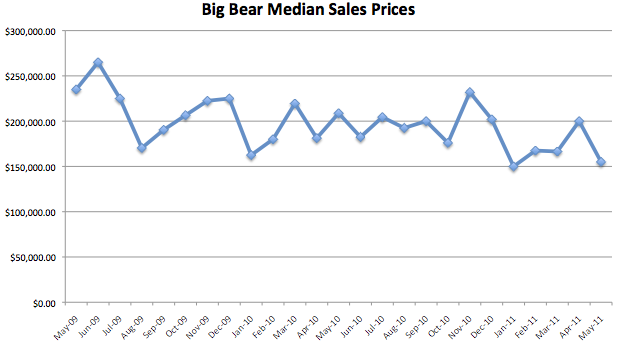
Year to date, the median sales price in Big Bear is down 9% from the 2010 sales. On a monthly basis, this number seems to be jumping all over the place – ranging from $150,000 in Jan. to $200,000 in April. With such a small amount of sales every month, this is to be expected. But one thing is for sure, the prices are still trending downward, especially over $300,000, which only makes up 31% of the sales. We haven’t seen the $150,000’s for the median price for many years.
Year over year, the May 2011 median sales price of $155,000 is down 26% from the May 2010 median of $208,750. Again, I wouldn’t put too much weight in that. With less the 60 sales, that number is bound to be all over the board.
Homes Currently on the Market
I have not kept up on tracking the number of homes on the market in Big Bear since November 2010, so I won’t be able to provide you would an accurate graph. But, based on the numbers from last year, we have the same amount of homes for sale now that we had last year – 789. Either way, it doesn’t look like much has changed there – we have not seen a huge decrease or increase in the number of homes for sale. I do, however, expect it to rise a bit as we head into the summer selling season. That is pretty much expected this time of year.
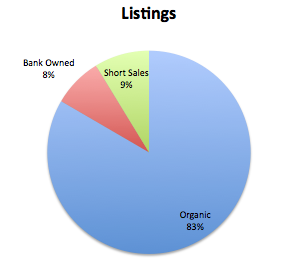
Here’s the breakdown of the current listing inventory (789) – Organic, bank owned, and short sales.
It’s still important to note that while bank owneds and short sales only make up 17% of what is currently for sale, they make up nearly 50% of what is selling (see sales charts above). You must compete with that if you are trying to sell and want to get your property sold.
Big Bear Home Sales – Thru May 2011
| Month and Year | # Homes For Sale | Median Asking Price | # Homes Sold | Median Sales Price | Average Sales Price |
|---|---|---|---|---|---|
| May 2011 | 789 | $249,500 | 54 | $155,000 | $265,472 |
| April 2011 | – | – | 61 | $200,000 | $246,303 |
| Mar 2011 | – | – | 66 | $166,500 | $247,950 |
| Feb 2011 | – | – | 66 | $167,500 | $255,126 |
| Jan 2011 | – | – | 57 | $150,000 | $188,332 |
| Dec 2010 | – | – | 106 | $202,000 | $249,841 |
| Nov 2010 | 715 | $265,000 | 95 | $232,000 | $239,401 |
| Oct 2010 | 756 | $262,450 | 79 | $176,000 | $240,034 |
| Sept 2010 | 837 | $268,000 | 84 | $200,000 | $286,757 |
| Aug 2010 | 894 | $275,000 | 70 | $197,500 | $279,216 |
| July 2010 | 860 | $299,000 | 66 | $204,450 | $259,940 |
| June 2010 | 810 | $295,000 | 72 | $182,500 | $249,756 |
| May 2010 | 789 | $299,000 | 58 | $208,750 | $255,294 |
| April 2010 | 681 | $289,900 | 76 | $181,250 | $229,149 |
| Mar 2010 | 633 | $279,900 | 74 | $219,500 | $256,236 |
| Feb 2010 | 617 | $285,000 | 62 | $180,000 | $254,124 |
| Jan 2010 | 624 | $298,750 | 57 | $162,500 | $216,260 |
| Dec 2009 | 661 | $289,900 | 80 | $227,500 | $312,925 |
| Nov 2009 | 709 | $299,900 | 91 | $219,900 | $257,895 |
| Oct 2009 | 765 | $299,900 | 94 | $206,500 | $294,916 |
| Sept 2009 | 807 | $310,000 | 95 | $184,900 | $239,625 |
| Aug 2009 | 864 | $313,000 | 79 | $178,000 | $250,120 |
| July 2009 | 909 | $309,000 | 87 | $225,000 | $280,787 |
| June 2009 | 927 | $310,000 | 79 | $252,000 | $293,661 |
| May 2009 | 902 | $316,000 | 58 | $226,000 | $309,806 |
Year to Date Comparison (1/1 – 5/31)
| Year | # of Homes Sold | Median Sales Price | Average Sales Price | Days on Market | List Price to Sales Price |
|---|---|---|---|---|---|
| 2011 | 304 | $170,000 | $241,074 | 131 | 95% |
| 2010 | 326 | $187,500 | $242.756 | 131 | 96% |
| 2009 | 288 | $208,750 | $281,027 | 132 | 94% |
| 2008 | 231 | $286,900 | $366,669 | 136 | 94% |
| 2007 | 351 | $315,000 | $410,399 | 126 | 96% |
| 2006 | 471 | $320,000 | $401,540 | 76 | 97% |
| 2005 | 636 | $265,500 | $331,560 | 83 | 98% |
| 2004 | 701 | $215,000 | $260,600 | 90 | 97% |
Want more? Be sure to sign up for our email newsletter or RSS feed.
* Note: The charts above represent single family home sales in the Big Bear area, including Big Bear Lake, Big Bear City, Moonridge, Fox Farm, Sugarloaf, Erwin Lake, & Fawnskin. Data courtesy of the Big Bear MLS. These numbers do not include raw land or condos nor does it include homes in the Big Bear MLS that are located out of the Big Bear area or home sales not listed in the Big Bear MLS.




Speak Your Mind