Big Bear Home Sales After a big jump the first two months of 2009, home sales in Big Bear for March 2009 (54) slowed down a bit. Sales were up just 10% as compared to March 2008 (49), but were down 5% from the Feb. 2009 home sales (57). Year to date though, sales are are still up 44% from 2008 (164 vs. 113). 28, or 52%, of the 54 home sales in Big Bear were bank owned and 5, or 9%, were short sales. The 21, or 39%, other home sales in March 2009 were the organic sales. Expect the bank owned & short sale … [Read more...]
So, We’ve Hit Bottom In Big Bear……..Not So Fast!
[viddler id=8b2cd2a8&w=545&h=349] There's been a lot of talk recently about the real estate market in Big Bear hitting the bottom. Rightfully so, with sales up nearly 50% from last year, interest rates under 5%, the number of properties on the market down 25%, and prices down 25% to 50% from their peak, it is natural to think we are there are close to it. I guess it depends on what you call the bottom, number of sales or prices? If it is sales, then yes, we already hit bottom last year. But, prices are … [Read more...]
Big Bear Real Estate Monday Market Update For 3/30/2009
Below is your weekly update for the Big Bear real estate market as of 3/30/2009. Property Type Listings for Sale Change from Last Week Pending Sales Change from Last Week Sales Year to Date Change from Last Week RESIDENTIAL 902 +2 128 +3 151 +12 VACANT LAND 360 +1 9 -1 6 +1 CONDOS 49 +2 3 -2 5 +2 GOVERNMENT LEASE 12 +1 0 0 0 0 COMMERCIAL & RES INVESTMENT 56 +2 4 -1 4 +3 BUSINESS OPPORTUNITY 13 0 1 0 0 0 TOTAL 1392 +8 145 -1 166 +18 These are the quick stats for the week - 32 new residential … [Read more...]
Big Bear Lakefront Sales – 2008
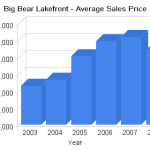
I've mentioned it here before, the lakefront real estate market in Big Bear is unique. So, when you talk about real estate in Big Bear, the lakefront market is a whole different conversation, as it should be. Up until the latter part of 2008, the lakefront market remained somewhat insulated from the price drops we were seeing in the rest of the market. But, in 2008, the average price for a lakefront property dropped nearly 11% from 2007. Couple that with the average days on the market jumping from 132 to 188, … [Read more...]
Big Bear Real Estate Monday Market For 3/23/2009
Below is your weekly update for the Big Bear real estate market as of 3/23/2009. Property Type Listings for Sale Change from Last Week Pending Sales Change from Last Week Sales Year to Date Change from Last Week RESIDENTIAL 900 +4 125 +7 139 +11 VACANT LAND 359 -2 10 +1 5 0 CONDOS 47 +2 5 +2 3 0 GOVERNMENT LEASE 11 -1 0 0 0 0 COMMERCIAL & RES INVESTMENT 54 -1 5 +1 1 0 BUSINESS OPPORTUNITY 13 0 1 0 0 0 TOTAL 1384 +2 146 +13 148 +11 These are the quick stats for the week - 32 new residential … [Read more...]
Big Bear Real Estate Monday Market Update For 3/16/2009
Below is your weekly update for the Big Bear real estate market as of 3/16/2009. Property Type Listings for Sale Change from Last Week Pending Sales Change from Last Week Sales Year to Date Change from Last Week RESIDENTIAL 896 +6 118 -1 128 +13 VACANT LAND 361 -1 9 -1 5 +1 CONDOS 45 0 3 -1 3 0 GOVERNMENT LEASE 12 0 0 0 0 0 COMMERCIAL & RES INVESTMENT 55 +2 4 +1 1 0 BUSINESS OPPORTUNITY 13 +1 1 0 0 0 TOTAL 1382 +8 135 -2 137 +14 These are the quick stats for the week - 38 new residential … [Read more...]
Big Bear Real Estate Market – Monthly Foreclosure Numbers February 2009
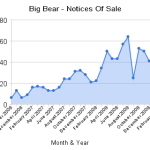
In order to know where we are going as a real estate market, it is important to see where we have been in the past. Without running the numbers and creating the foreclosure charts below, it would be impossible to really forecast what is coming down the pike in Big Bear. That said, the number of notices of default, notices of sale, and properties that went back to the bank in February 2009 were the highest we have seen since the tracking started in October of 2006. What does this mean? We are going to see many … [Read more...]
Big Bear Real Estate Monday Market Update For 3/9/2009
Below is your weekly update for the Big Bear real estate market as of 3/9/2009. Property Type Listings for Sale Change from Last Week Pending Sales Change from Last Week Sales Year to Date Change from Last Week RESIDENTIAL 890 +3 119 +6 115 +16 VACANT LAND 362 +3 10 +1 4 0 CONDOS 45 0 4 -1 3 +1 GOVERNMENT LEASE 12 0 0 0 0 0 COMMERCIAL & RES INVESTMENT 53 -2 3 -1 1 0 BUSINESS OPPORTUNITY 12 -1 1 +1 0 0 TOTAL 1374 +3 137 +6 123 +17 These are the quick stats for the week - 45 new residential … [Read more...]
Big Bear Home Sales – February 2009
Home sales in Big Bear for February 2009 (57) were up 68% as compared to February 2008 (34), and 21% compared to January 2009 (47). Year to date home sales are up 66%, not bad. The first four months of the year are the four slowest of the year, so the outlook this year is not as bad as you hear every day on the news. All real estate is local and this is good news for Big Bear. 27, or 47%, of the 57 home sales in Big Bear were bank owned and 5, or 8%, were short sales. The number of short sales in Big Bear … [Read more...]
Is The Real Estate Market Bottoming Out? Some Signs Are Saying Yes.
Homes listed for sale plummeted across 96% of major U.S. markets and the Big Bear real estate market is looking to be on the same path. If you asked an economist why home prices have broadly fallen over the past 2 years, you'd get a short lesson in Supply and Demand. Too many homes for sale and not enough people to buy them pushed values lower until a balance point can be reached. Looking at the chart at right, that balance point may be fast approaching. According to data compiled by ZipRealty, the total number … [Read more...]

