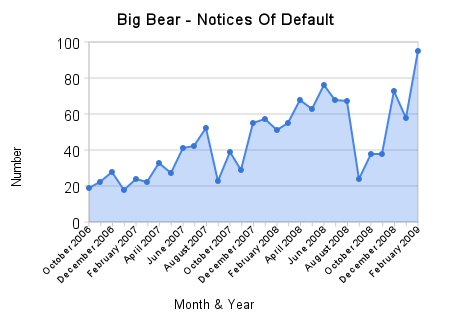
Notices of Default (NOD) in Big Bear eclipsed the 100 mark for the first time in history during March 2009. Up 13% from the previous high of 95 NODs in February 2009, the new record set in March was 107 NODs. This means more and more properties in the Big Bear area going into default, a majority of which will most likely be bank owned in 6-12 months.

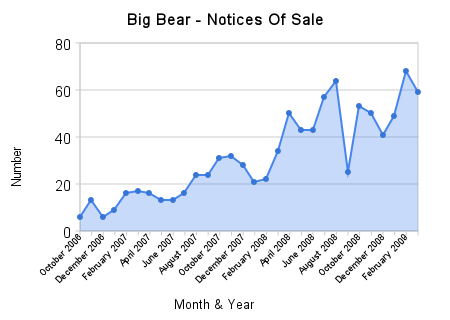
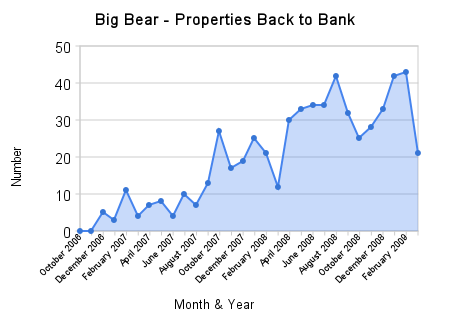
While the NODs were up, the Notices of Sale (NOS) and the number on properties that went back to the bank were down.

NOSs were down 13% in March, from 68 in Feb. to 59. Keep in mind that the 68 we saw in Feb. was the highest on record for Big Bear.
Properties that went bank were down 51%, from 43 to 21 in March 2009. That is a big drop considering there were a lot of Big Bear properties set to be sold at the Trustees sales in March.

This decline can be attributed to the banks willingness and desire to try all reasonable alternatives other than foreclosing on the property – refinancing, loan modifications, short sales, and giving the owner more time to pay back the defaulted amount. In some cases, this might end up helping out. But, in most cases, it will most likely just delay the inevitable and that is the property going back to the bank.
There is a lot of chatter out there about the economy and housing market hitting the bottom. Low interest rates, lower numbers of properties on the market, increased sales, favorable rent vs. owner numbers, tax credits, new homes sales, are all the hot topics right now.
But, the key factor in my opinion are these foreclosure numbers. I don’t believe you can have a bottom with prices continuing to go down, even if the rate of depreciation is dropping. And with more foreclosures and bank owned properties hitting the market, this will continue to push prices downward, further delaying the bottom everyone, me included, wants so much to see.
Here are the foreclosure numbers broken down by each area in Big Bear –
92315 = Big Bear Lake, which is made of Big Bear Lake West (the Boulder Bay area), Big Bear Lake Central (the area around the Village), Big Bear Lake East (Eagle Point area, Summit Estates), most of the Fox Farm area (including Castle Glen, Eagle Mountain, Alpine Woods, and others), & most of the Moonridge area.
92314 = Big Bear City, which includes Erwin Lake, Lake Williams, Baldwin Lake, Whispering Forest, and small parts on Moonridge & Fox Farm.
92386 = Sugarloaf.
92333 = Fawnskin area of the North Shore.
Notices of Default
| Month/Yr. | 92315 | 92314 | 92386 | 92333 | Total |
|---|---|---|---|---|---|
| Mar. 09 | 31 | 49 | 22 | 5 | 107 |
| Feb. 09 | 30 | 54 | 9 | 2 | 95 |
| Jan. 09 | 19 | 32 | 6 | 1 | 58 |
| Dec. 08 | 18 | 38 | 15 | 2 | 73 |
| Nov. 08 | 21 | 14 | 3 | 0 | 38 |
| Oct. 08 | 11 | 17 | 7 | 3 | 38 |
| Sept. 08 | 13 | 8 | 2 | 1 | 24 |
| Aug. 08 | 24 | 29 | 14 | 0 | 67 |
| Jul. 08 | 25 | 33 | 10 | 0 | 68 |
| Jun. 08 | 27 | 35 | 14 | 0 | 76 |
| May 08 | 20 | 31 | 11 | 1 | 63 |
| Apr. 08 | 20 | 30 | 16 | 2 | 68 |
| Mar. 08 | 21 | 21 | 11 | 2 | 55 |
| Feb. 08 | 17 | 23 | 10 | 1 | 51 |
| Jan. 08 | 17 | 28 | 9 | 3 | 57 |
| Dec. 07 | 16 | 28 | 8 | 3 | 55 |
| Nov. 07 | 14 | 12 | 3 | 0 | 29 |
| Oct. 07 | 8 | 23 | 6 | 2 | 39 |
| Sept. 07 | 4 | 15 | 4 | 0 | 23 |
| Aug. 07 | 16 | 29 | 6 | 1 | 52 |
| Jul. 07 | 15 | 18 | 8 | 1 | 42 |
| Jun. 07 | 9 | 26 | 5 | 1 | 41 |
| May 07 | 13 | 11 | 5 | 0 | 27 |
| Apr. 07 | 12 | 15 | 5 | 1 | 33 |
| Mar. 07 | 4 | 12 | 5 | 1 | 22 |
| Feb. 07 | 5 | 12 | 7 | 0 | 24 |
| Jan. 07 | 4 | 11 | 3 | 0 | 18 |
| Dec. 06 | 7 | 14 | 7 | 0 | 28 |
| Nov. 06 | 6 | 14 | 2 | 0 | 22 |
| Oct. 06 | 8 | 7 | 3 | 1 | 19 |
Notices Of Sale
| Month/Yr. | 92315 | 92314 | 92386 | 92333 | Total |
|---|---|---|---|---|---|
| Mar. 09 | 17 | 30 | 11 | 1 | 59 |
| Feb. 09 | 20 | 23 | 5 | 0 | 68 |
| Jan. 09 | 20 | 17 | 10 | 2 | 49 |
| Dec. 08 | 15 | 19 | 7 | 0 | 41 |
| Nov. 08 | 22 | 22 | 6 | 0 | 50 |
| Oct. 08 | 18 | 24 | 11 | 0 | 53 |
| Sept. 08 | 10 | 11 | 4 | 0 | 25 |
| Aug. 08 | 23 | 30 | 11 | 0 | 64 |
| Jul. 08 | 11 | 27 | 16 | 3 | 57 |
| Jun. 08 | 16 | 18 | 9 | 0 | 43 |
| May 08 | 11 | 21 | 9 | 3 | 44 |
| Apr. 08 | 16 | 23 | 10 | 1 | 50 |
| Mar. 08 | 8 | 19 | 6 | 1 | 34 |
| Feb. 08 | 6 | 10 | 6 | 0 | 22 |
| Jan. 08 | 7 | 11 | 3 | 0 | 21 |
| Dec. 07 | 8 | 16 | 3 | 1 | 28 |
| Nov. 07 | 9 | 18 | 5 | 0 | 32 |
| Oct. 07 | 9 | 15 | 6 | 1 | 31 |
| Sept. 07 | 6 | 16 | 2 | 0 | 24 |
| Aug. 07 | 9 | 9 | 6 | 0 | 24 |
| Jul. 07 | 3 | 6 | 6 | 1 | 16 |
| Jun. 07 | 3 | 7 | 2 | 1 | 13 |
| May 07 | 5 | 6 | 2 | 0 | 13 |
| Apr. 07 | 3 | 10 | 3 | 0 | 16 |
| Mar. 07 | 3 | 11 | 3 | 0 | 17 |
| Feb. 07 | 5 | 9 | 2 | 0 | 16 |
| Jan. 07 | 5 | 2 | 1 | 1 | 9 |
| Dec. 06 | 0 | 5 | 1 | 0 | 6 |
| Nov. 06 | 6 | 5 | 2 | 0 | 13 |
| Oct. 06 | 3 | 2 | 1 | 0 | 6 |
Properties that went back to the Bank
| Month/Yr. | 92315 | 92314 | 92386 | 92333 | Total |
|---|---|---|---|---|---|
| Mar. 09 | 10 | 7 | 4 | 0 | 21 |
| Feb. 09 | 14 | 18 | 11 | 0 | 43 |
| Jan. 09 | 8 | 17 | 17 | 0 | 42 |
| Dec. 08 | 14 | 14 | 5 | 0 | 33 |
| Nov. 08 | 9 | 14 | 5 | 0 | 28 |
| Oct. 08 | 10 | 12 | 3 | 0 | 25 |
| Sept. 08 | 10 | 18 | 4 | 0 | 32 |
| Aug. 08 | 8 | 17 | 14 | 3 | 42 |
| Jul. 08 | 13 | 14 | 6 | 1 | 34 |
| Jun. 08 | 13 | 12 | 8 | 1 | 34 |
| May 08 | 9 | 16 | 7 | 1 | 33 |
| Apr. 08 | 7 | 16 | 6 | 1 | 30 |
| Mar. 08 | 2 | 7 | 5 | 0 | 12 |
| Feb. 08 | 9 | 7 | 4 | 1 | 21 |
| Jan. 08 | 3 | 18 | 4 | 0 | 25 |
| Dec. 07 | 7 | 10 | 2 | 0 | 19 |
| Nov. 07 | 4 | 8 | 4 | 1 | 17 |
| Oct. 07 | 9 | 16 | 2 | 0 | 27 |
| Sept. 07 | 4 | 5 | 4 | 0 | 13 |
| Aug. 07 | 0 | 6 | 1 | 0 | 7 |
| Jul. 07 | 2 | 5 | 3 | 0 | 10 |
| Jun. 07 | 0 | 3 | 1 | 0 | 4 |
| May 07 | 2 | 4 | 2 | 0 | 8 |
| Apr. 07 | 1 | 4 | 2 | 0 | 7 |
| Mar. 07 | 1 | 3 | 0 | 0 | 4 |
| Feb. 07 | 3 | 6 | 2 | 0 | 11 |
| Jan. 07 | 0 | 3 | 0 | 0 | 3 |
| Dec. 06 | 1 | 2 | 2 | 0 | 5 |
| Nov. 06 | 0 | 0 | 0 | 0 | 0 |
| Oct. 06 | 0 | 0 | 0 | 0 | 0 |
Related Articles
Big Bear Real Estate Market – Monthly Foreclosure Numbers February 2009


Dude the stats are cool, but they are overwhelming for a person like me that is not so detail oriented. I miss the videos driving down the road.
Aloha,
Keahi
Thanks Keahi,
I try to do a mixture of both. I’ll have a video for you soon enough.