Active Listings % of Total Pending Listings % of Total Sold Listings Last Year % of Total Mom & Pop Seller 775 83% 36 31% 534 80% Bank Owned 69 7% 52 46% 115 17% Short Sales 89 10% 26 23% 18 3% Total 933 114 667 As evidenced in the table above, bank owned and short sale homes have taken a larger piece of the overall real estate pie here in Big Bear. 80% of the home sales in Big Bear for 2008 were your traditional, Mom & Pop seller. That made sense as there was a similar percentage, 90-95%, … [Read more...]
The Best In Show Is First To Go
[viddler id=9775a0e6&w=545&h=349] Everyone knows it is tough to sell a home in this market. It is not impossible though. While there are some things you cannot control, like location, there are certainly some other things that you can. The asking price, the overall property condition, showing restrictions and the like are all things well within a seller's choice to make. Whether they decide to make the right choice is up to them. The two most important factors in getting a home sold in today's market … [Read more...]
The Big Bear MLS – Is Your Property In It?
The vast majority of properties sold in Big Bear are sold by real estate agents who live, work, and breath in Big Bear. Yet, some sellers (read:banks) list their properties with out of area agents who don't have much experience selling property in Big Bear. It is kind of like a knee doctor working on your elbow. Can they do it? Sure, but are they really the expert? What's worse is these real estate agents rarely put the listing in the local Big Bear MLS (Multiple Listing Service). How are the local agents … [Read more...]
Big Bear Real Estate – Monday Market Update For 1/19/2009
Below is your weekly update for the Big Bear real estate market as of 1/19/2009. Property Type Listings for Sale Change from Last Week Pending Sales Change from Last Week Sales Year to Date Change from Last Week RESIDENTIAL 936 0 113 -2 21 +15 VACANT LAND 339 +1 9 +1 0 0 CONDOS 51 0 5 +3 1 0 GOVERNMENT LEASE 11 0 0 0 0 0 COMMERCIAL & RES INVESTMENT 52 +1 3 -1 0 0 BUSINESS OPPORTUNITY 12 -2 0 0 0 0 TOTAL 1401 0 130 +1 22 +15 A few notes about the market - The residential inventory leveled off … [Read more...]
Absorption Rates For The Big Bear Real Estate Market – December 2008
If you are thinking of buying or selling a home in Big Bear, you may want to take a look at the absorption rate of homes that are currently for sale. Knowing the absorption rate is a good way to become more informed on the current real estate market conditions in a particular area. In simplistic terms, it is a mathematical equation that tells the amount of time it will take for a specified set amount of properties to be absorbed under current real estate market conditions. I like to look at it from a monthly … [Read more...]
How Not To Reduce The Price Of Your Big Bear Home
Price reductions are commonplace in today's real estate market. Many days, they actually outnumber the number of closed sales & new pending sales. Price reductions happen because the seller or real estate agent overestimated the market value of the property in the beginning and the buyers reject it. Dropping the price is not necessarily a bad thing, it happens. But, the key reason to drop the price is to spark some interest, generate some activity, and hopefully, an offer. Many times though the seller only … [Read more...]
Big Bear Real Estate – Monday Market Update For 1/12/2009
Below is your weekly update for the Big Bear real estate market as of 1/12/2009. Property Type Listings for Sale Change from Last Week Pending Sales Change from Last Week Sales Year to Date Change from Last Week RESIDENTIAL 936 -18 115 +9 6 +6 VACANT LAND 338 -3 8 +2 0 0 CONDOS 51 +3 2 -1 1 +1 GOVERNMENT LEASE 11 0 0 0 0 0 COMMERCIAL & RES INVESTMENT 51 +1 4 -1 0 0 BUSINESS OPPORTUNITY 14 -1 0 0 0 0 TOTAL 1401 -18 129 +10 7 +7 A few notes about the market - The residential inventory … [Read more...]
Big Bear Real Estate Market – 2008 Breakdown
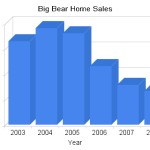
Below is the breakdown for the Big Bear real estate market in 2008. Big Bear Home Sales As previous mentioned on this blog, the residential sales, or homes sales, made up a significant amount of the sales in 2008, nearly 85% of the total market. Year # of Homes Sold % Change Median Sales Price % Change Average Sales Price % Change Days on Market List Price to Sales … [Read more...]


